From a technical perspective the Indian Stock Market is building a massive rounding top which ties in well with the sentiment prevailing in the market.
We are going to spend the next few years going down. Each time the market looks like it is off to the races, investors will jump in and subsequently get killed. It's going to be a very long decline.
Every time the bottoms and rallies, people are going to say "OK, that's enough; it's over." But it won't be over. It's just going to be a long, long process. It will take a long time for Indian optimism to break down and reality to set in that the Indian story is closely linked, like every other country now, to global growth.
Optimism should actually remain dominant through the next two years and even as prices will be edging lower, most people are going to think it's a buy, and you shouldn't get out of your stocks, and recovery is just around the corner, probably for the next three years. And then, for the final half of the cycle, the final three years, that's when you'll get the capitulation phase when everyone finally gives up.
This is a non consensus view, as today the prevailing sentiment in the market is strongly optimistic.
Showing posts with label Stock Market Forecast. Show all posts
Showing posts with label Stock Market Forecast. Show all posts
Tuesday, July 6, 2010
Traxis Partners - Getting It Wrong.. Consistently - Perfect Contrary Indicators
In the summer of 2008, many of you may not remember this, Cyrille Moulle Bertaux of Traxis Partners came out with a WSJ article telling us that housing had bottomed and he had charts and data and analyses that convinced Traxis that the bottom in housing and the market was near.
Barton Biggs was consistently bullish through S&P 880 and the market bottomed at 666.
Then in May of this year, we had Barton Biggs on Bloomberg when the S&P was around 1180 telling us that the economic recovery was strong and he saw another 15% upside in the markets.
As more of these bull market gurus fall, all it does is convince me that the entire pay structure for fund managers and Wall Street is skewed and this will be corrected before all is said and done.
Less than 1% of these guys has any skill. The overwhelming majority are idiots and clueless about the markets and should not be managing money.
The only bigger idiots are the institutions that buy into their pitches and invest with them.
Barton made his name with the bull market of the 80s. What is it that they say, do not confuse a bull market with brains?
Interestingly, Charles Reinhardt of Morgan Stanley is another uber bull equity whore that was predicting a multi year bull market at precisely the top on the S&P 500 in May.
Wall Street has truly become a wasteland and is being exposed for what it is - a bunch of talent less over paid back stabbers that will do anything to make a buck.
You would do well to ignore ALL advice you receive from investment companies, whether in the U.S. or India.
Wednesday, June 30, 2010
Investment in stocks NOT a must for a complete and balanced portfolio
The Economic Times reports today

They trot out Infosys and Tata Steels. Tata Steels share price performance is shown above. What if you were unfortunate enough to have bought tin 2006 and sold in fear in 2009? You would have a significant loss!
That is the issue that unsuspecting investors in India are learning for themselves. Stop listening to the mutual fund industry marketing buzz and start being wise investors.
There is a time to buy equities and when that time comes, I will invest agressively. Today is not that time.
Success in the markets requires patience and waiting for the fat pitch. Investors entering the market today are likely going to be disappointed as opposed to investing in secure investments.
Investment in stocks must for a complete and balanced portfolioInvestments in equity WILL? pay 26.5% higher returns in 5 years? Well there you have it... Economic Times India writers know exactly what equity market returns will be in 5 years. And if they know what equities are going to do, why are they writing newspaper articles, they should be hedge fund managers.
'If you really want your money to grow - stocks is the only way to go'- Haven't you heard this umpteen times. Well, it holds true every time.
As compared to fixed deposits, investments in equity will pay 26.5 per cent higher returns in 5 years. Even for a longer term, investment in stocks pay higher returns even in comparison to real estate and gold.

They trot out Infosys and Tata Steels. Tata Steels share price performance is shown above. What if you were unfortunate enough to have bought tin 2006 and sold in fear in 2009? You would have a significant loss!
That is the issue that unsuspecting investors in India are learning for themselves. Stop listening to the mutual fund industry marketing buzz and start being wise investors.
There is a time to buy equities and when that time comes, I will invest agressively. Today is not that time.
Success in the markets requires patience and waiting for the fat pitch. Investors entering the market today are likely going to be disappointed as opposed to investing in secure investments.
Tuesday, June 29, 2010
Management Hubris - India Decoupling Stock Market Will Be A Myth
How ironic that HDFC's Aditya Puri's article prints today just when the China market is down roughly 5%.
Here is the link to HDFC Aditya Puri article "Decoupling is set to become a reality soon" a self serving media spin article by the head of HDFC Bank
I am going to deconstruct his comments. Mr. Puri makes the argument - correctly - that European and American economies are struggling and the world has changed structurally. True, no arguments there.
These same economists were forecasting similar forecasts for Japan in the late 80s and the Tiger economies in the mid 90s.
Further, Europe has exported a 20% decline in its currency, the net result of which will be a deterioration in competitiveness for India and China.
It is shocking to me that the CEO of one of our major banks does not recognize the risks posed by a rising Rupee. The consensus today is that India will decouple. The consensus will be proven wrong in the near future, yet again.
Mr Aditya Puri might want to check the performance of China over the past 12 months and would see that the present market correction / selloff initiated in China.
We are entering a phase where the recession is about to be exported to Asia. Europe and U.S. have experienced significant declines and a severe recession. However, a double dip is likely headed. This time around, emerging markets will suffer along side global markets.
There is no decoupling.
Here is the first piece of news that Mr. Puri would do well to read.
Chinese growth May Slow
Here is the link to HDFC Aditya Puri article "Decoupling is set to become a reality soon" a self serving media spin article by the head of HDFC Bank
I am going to deconstruct his comments. Mr. Puri makes the argument - correctly - that European and American economies are struggling and the world has changed structurally. True, no arguments there.
Really? I would love to know when the markets corrected in Nov 2007 they foresaw a correction ahead in 2008. I do not know if Mr. Puri made any such calls and protected his stockholders. Fact is that yes, markets do forecast 9 of the past 5 recessions but they usually are smarter in sum than any one individual. Anyone that considers himself smarter than the market is suffering from a God complex and has an ego problem.
The financial markets, however, are slow learners, creatures of habit, and therefore, create confusion in the short-term or transition (defined as volatility) period.
The forecast GDP growth rate during the next 3-5 years for the following countries are (%): US: 1.8; Europe: 0.8; East Asia: 8; China: 8.5; India: 8. This reflects the level of structural adjustments required in the Western countries in terms of asset bubbles, financial contagion, stimulus, exchange rate, etc.I am stunned that any corporate executive would be out there spewing forecast statistics, that too from economists? Economists forecasting record for this cycle and most cycles in my lifetime has been dismal. The fact that economists are forecasting 8% growth rates for Asia is meaningless.
These same economists were forecasting similar forecasts for Japan in the late 80s and the Tiger economies in the mid 90s.
Yes, investors will probably flock to Asia to seek higher returns. However, in a bear market, there are no safe havens. Just as almost every company benefited during the bull market from global market expansion, what I am seeing today is that there is deflation in Europe and the U.S. and wages are falling dramatically in these countries while wages are rising and inflation is rising in India and China.
Besides, investors seeking higher returns on their investment will flock to Asia; this will result in a flood of capital and Asian currencies will see a phase of secular rise against their G-7 counterparts. This could erode export competitiveness, and economies within Asia such as India and Indonesia that are more internally focused, will outperform the others.
Further, Europe has exported a 20% decline in its currency, the net result of which will be a deterioration in competitiveness for India and China.
It is shocking to me that the CEO of one of our major banks does not recognize the risks posed by a rising Rupee. The consensus today is that India will decouple. The consensus will be proven wrong in the near future, yet again.
Mr Aditya Puri might want to check the performance of China over the past 12 months and would see that the present market correction / selloff initiated in China.
We are entering a phase where the recession is about to be exported to Asia. Europe and U.S. have experienced significant declines and a severe recession. However, a double dip is likely headed. This time around, emerging markets will suffer along side global markets.
There is no decoupling.
Here is the first piece of news that Mr. Puri would do well to read.
Chinese growth May Slow
Saturday, November 14, 2009
Richard Russell - 6 Reasons to Own Gold
(1) Interest rates are at zero, which means the ‘opportunity cost’ of owning gold now is highly favorable. You sacrifice no yield in owning gold vs. Treasury bills. T-bills pay you nothing, so you might as well have your money in gold.
(2) The Bernanke Fed will evidently stop at nothing in its all-out attempt to ‘jump start’ the wobbly US economy. This means spending and building debt at a never-seen-before rate. This will result in inflation. The Fed can create fiat money - any quantity at will, but it cannot direct where that money will go. So far, the money is not going into the economy, banks remain reluctant to lend and consumers are reluctant to spend.
The newly-created money has been going into bank reserves and into the stock market. Stocks have been rising on an ocean of liquidity. The sinking dollar has been a huge help to the big Dow-type stocks which benefit from their ability to export. This is resulting in world-wide central bank inflation as the banks seek to devalue their money in an effort to keep the dollar strong.
(3) The world’s central banks are now seeking to protect themselves from a falling dollar by buying gold. After years of selling gold, ironically, the central banks are now buying gold. In today’s Wall Street Journal we see the headline, ‘Central Banks Join A New Gold Rush’. This is indeed ironic. In swapping their own paper for gold, many central banks are admitting that gold is superior to the very paper they are creating out of thin air.
(4) Many nations are now seeking to boost the ratio of gold to paper in their reserves. The US has the largest ratio of gold to junk fiat paper, 77.4%. But the US stupidly only places the value of our gold at $42.22 an ounce. If the US marked our gold to market, it would be a tremendous help to our government’s balance sheet. But the US prefers to live in a fantasy world where gold is worth less than $50 an ounce!
Germany has 69.2% of its reserves in gold.
Italy has 66.6%.
France has 70.6%.
UK has 17.6% (after idiotically selling most of its gold near the low below $300 an ounce).
Japan has 2.3% of its reserves in gold.
India has 4.0%.
Russia has 4.3%.
China has 1.9%.
India has 4.0%.
Russia has 4.3%.
China has 1.9%.
It’s easy to see that Russia, India and China are low on gold. All three would like to at least double the percentage of gold in their reserves. The race is on for these central banks to accumulate gold without running the price of gold sky-high.
(5) In the US, literally no one owns gold. Rather, US citizens are selling their gold (jewelry) to companies who are advertising that they’ll buy ‘your overpriced’ gold for cash.
(6) A few nations are actively promoting the ownership of gold. China, the world’s biggest miner of gold, has been encouraging its people to buy gold. In London, Harrod’s department store is now selling gold coins and bars to anyone who has the paper to buy gold. Within a year or so, I expect public buying of gold to reach a crescendo. Interestingly, most Americans have never seen a gold coin.”
Friday, November 13, 2009
Last Move Up Underway - 1121 Target One Likely Scenario
The market is on its last move upwards, ignoring a turd like consumer sentiment reading, a rise in natural gas inventory this morning.
Time
Right now, November 19th looks like a good time target as a 50% retrace in terms of the final move upwards. But it could extended to early December. So much as I'd like to get back in, I'm going to twiddle my thumbs for a while this as this hopefully final move higher works its way through and start rebuilding short positions on strength.
Price
1121 is roughly the 50% retrace of the entire move down. We are right now close to resistance on a down trend line from Oct 07. A breakout through the trend line freaking technicians out and a fall back under looks to me to be one scenario to watch for.
Pattern
We are completing a 5 wave move up, the trend looks to be completing.
Monday, November 9, 2009
Revising Upside Targets to 1123.15
Significant resistance exists at S&P 1123. Any and all bears have been beaten to a pulp exactly what you would expect as the market reaches a topping point for this bear rally. The Fed and free money will fix everything.
The poorest consumers get hosed. Americans will struggle mightly - all but the richest anyways - to take a trip outside the U.S.
At the rate the government is going, Walmart will become Whole Foods.
I am going to stay bearish until 1123. Fortunately I took profits at 1046 and anticipated a ramp up to 1066. At that point, if the market continues to demonstrate strength, I will take my lumps and move to the sidelines.
Momentum following idiots are making hay. Any thoughtful analysis of the future impacts can be discarded. One only need to look to the Fed and see that the money printing is out in the open. Nothing else matters.
If the U.S. can extricate itself out of this by inflating their way, it will kill the field of economics as we know it and we can call the new science Bernankism, the science of inflating to prosperity.
Thursday, November 5, 2009
Possible Upside Targets

Typical targets for this upmove : 1074.04 - 1076.59
But I always remind myself that the market never does the obvious thing (hat tip Atilla) and always has something up its sleeve.
Market at Price, Time & Moving Average Resistances, But Pattern Not Yet There
Markets are now in an interesting setup. We are approaching the 38% time retrace on the move down at the same time that unemployment is due. Further, the market's progress today was halted at the 50% retrace.
Fundamentally a significant amount of optimistic expectations about the jobs report are embedded in the market. Any disappointment would see a selloff. On the other hand, given the optimistic move the past few days, a better than expected number would see a small rally and a sell the news type of event.
This is not a projection, I don't make short term daily market forecasts, leave that to the traders.
But this does offer a juicy setup. We're at an 50% retrace on the up move, a 38% time retrace, and also butting up the under side of the uptrend line.
Further, we are approaching the 20 day moving average. And if the market manages to get past all this resistance, we have the mother of all trend lines sitting in the 1080s that repelled the market recently.
Edit: 4pm: Pattern is now nearing completion and we are in the last stages of the rally in my opinion.

Tuesday, November 3, 2009
Gold Target 1250 to 1300

A classic inverse head and shoulders pattern projects the Gold price to 1250 to 1300. Strong technical support, strong central banker emerging interest, strong public sentiment, strong Chinese demand. Good luck to the two major institutions that are rumored to be short this currency.
Saturday, October 31, 2009
Reasons For Bearishness Continue - Oct 31, 2009
1. Technical Breakdown The S&P 500 is riding a four-day losing streak. And while we have seen these corrections turn around before during this massive bear market rally that started last March, the difference this time is that the uptrend line from the lows has been violated across a fairly broad front, including the S&P 500, Nasdaq and the Russell 2000. When trend lines get violated, and when this happens on high volume, it usually, though not always, signals something big.
2. Valuation In terms of valuation, we said yesterday that the P/E ratio on the S&P 500 on a normalized 10-year basis is 22x and the long-turn norm is 16x. Just to go back to the norm, let alone compress to a level commensurate with an unusually high level of economic and financial uncertainty, would suggest that we would see the S&P correct down towards 860.
3. Fannie Mae: Delinquencies Increase Sharply in August
Fannie Mae reported today that the rate of serious delinquencies - at least 90 days behind - for conventional loans in its single-family guarantee business increased to 4.45% in August, up from 4.17% in July - and up from 1.57% in August 2008.
We are back in the bubble years offering zero down payment homes, 125% LTV loans to unsuspecting first time home buyers. Yet another case of trying to create a bubble to solve our problems.
4. Courtesy ZeroHedge - CRE Crash & Implied Lack of Fed Support Will Hurt Bank Balance Sheets
In what could have been the biggest piece of news today, yet making little headway into the media, the Fed announced that it is adopting a policy statement supporting "prudent commercial real estate loan workouts."
The Fed seems to now be encouraging active loan workouts as a matter of policy. The other implication is that firms with CRE exposure can no longer rely on the Fed as a perpetual guarantor of risky exposure. Not only that, but in adopting a new policy strategy, the Fed is acknowledging the major problem that CRE writedowns will represent for banks, yet is telling banks to resolve problems on their own, while subsequently they will "not be subject to criticism for engaging in these efforts."
The implications of this Fed action for the economy could be staggering as the $3.5 b,quadr,trillion CRE market will likely not receive the same largesse that residential real estate has been the recipient of ever since the conservatorship of the GSEs. And the biggest loser in all of this will be banks that still have not used the massive risk rally to offload whole loan and CMBS CRE holdings, and moreover, still have these marked at par or close thereby.
As Wilbur Ross and George Soros pointed out earlier, the trouble for CRE is just starting. If the Fed is unwilling to recreate QE for CRE, in the same way that it continues to bail out residential exposure, then look for a major double dip in the economy. The only wild card is why the Fed is letting this happen, although if the political backlash against just QE 1 is any indication, then it likely would not have been able to pass additional liquidity measures regardless.
5. And out of the Economist, America’s debt crisis will be chronic, not acute
AS AMERICA’S financial crisis recedes, the rumblings of its next crisis can be heard. The federal government has wrapped its guarantees around banks and the housing market. It has borrowed hundreds of billions of dollars to stimulate the enfeebled economy, while tax revenues crumble. And in the years to come the cost of retirees’ benefits will explode. “There is every reason to worry that the banking crisis has simply morphed into a long-term government-debt crisis,” says Kenneth Rogoff of Harvard University.
The Treasury’s ravenous borrowing needs also leave lots of opportunities for something to go wrong. In the past two years the portion of its debt maturing in less than a year has jumped from 30% to over 40%, the most since the early 1980s
In the fiscal year that ended on September 30th the Treasury held an auction on average more than once a day to finance nearly $7 trillion of new and maturing debt. A failure to raise as much money at an auction as planned—as occurred in Britain earlier this year—could send a shudder through global financial markets. “Other countries can afford a failed auction; we can’t,” says Lou Crandall, chief economist at Wrightson ICAP, a financial-research firm. “What do you do when there is a confidence shock to your flight-to-safety asset?”
6. Number of Vacant Homes Rising Again
The US Census Bureau has released its Third Quarter report on Residential Vacancies and Homeownership. As can be seen from the attached chart, the number of vacant homes in Q3 has started increasing once again after posting moderate improvements over the prior two quarters, and is now at 18.8 million units, rising from 18.4 million in the prior year. With new home sales surprising to the downside, look for this number to continue increasing into the fourth quarter. Notable is that the rental vacancy rate stood at an all time high of 11.1%. As James Lockhart, former director of the FHFA which he singlehandedly managed to destroy said: "We are bumping along the bottom of the housing market. There is the potential for another swing down." Don't tell that to the GDP numbers.
Wednesday, October 28, 2009
Ten Reasons This Market Has Peaked Or Close to Peaking
Even though I'm not a technician by trade, I must begin with technicals because fundamentals have not driven this market rally. In my opinion, this has been a speculative, technical bounce similar to past rallies off severely oversold conditions especially involving the Fed and loose monetary policy.
Technicals - Time Price & Pattern Coinciding Suggest A Major Trend Change Is Imminent
The prevailing consensus is that Elliott Wave Theory is for crackpots and cannot be used profitably. Most analysts would agree with that opinion.
However, Elliot Wave (EW) was one of the few technical analyses to predict that the market would have a tremendous rally from the lows. Not only that we were able to exit the market at 682 based on a clearly identifiable pattern completion. While the consensus on EW is that it's a tough strategy to make money with, I'd point out that EW was used by legendary investors like Paul Tudor Jones to forecast and profit from the 1987 crash. More recently, Robert Prechter gained fame with an 800 point forecast shorting the S&P at the top and exiting at 720.
Most particularly, EW is at its most reliable when three factors - time, price and pattern - coincide. At these times, trend change is inevitable. Time will tell obviously as these are interesting times we live in.
1. Time - From October 2007, the S&P has completed a 38% time retrace and will complete a 50% time retrace on November 17th
2. Price - From Octoer 2007, the S&P has completed a 38% price retrace from the March lows and is nearing a 50% price retrace at 1117
3. Pattern - Since the March Lows, the S&P has completed an ABC corrective pattern
In our opinion, EW is forecasting that we are near completion of a multi month trend and an imminent change in direction is coming.

4. October 2007 Trendline Rejection & 5. March 2009 Trendline Break
As you can hopefully see from the chart above, the March 2009 trendline was convincingly broken today. In addition, the S&P 500 was repelled convincingly from a major trend line (Oct 07 to Apr 08) and the volume on the selloff has been larger than in recent weeks. The selloff has also been impulsive, again a strong indicator that we could be in for a change in market character. We remain bearish until the market can convincingly pierce through the major trendline.
Fundamentals
6. Valuation - Analyst estimates for 2010 are overly optimistic

But Wall Street's prescient analysts are forecasting the S&P will grow earnings by 34% in 2010, Consumer Discretionary will grow 58%, Energy 89%, Financials 137%, Tech 30% and Materials by 94%!
We've seen this same story since March 2008. Analysts are overly optimistic. On trailing earnings, using the generous operating earnings measure, the S&P is still at a very pricey 26 times earnings.
7. The Debt Piper Will Need to Be Paid - Julian Robertson, Tiger Capital
What most Wall Street investors are conveniently forgetting is that the U.S. government's bandaid approach to handling crises has created debts that will stay with us at best for a long long time and at worst send us the way that Japan is headed. David Einhorn of Greenlight Capital illustrates it far better than I could:
I won't bore you with the details but there is hardly any evidence of an economic recovery. Most of the earnings beats have been due to cost cutting and playing the Wall Street game of earnings beating "forecasts".
9. This rally is more likely a dead cat bounce similar to 1929-30
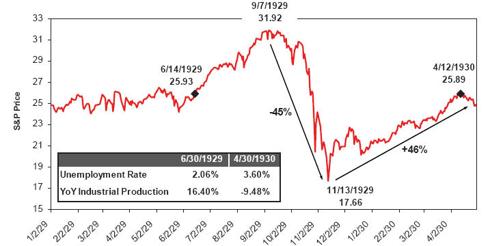
Source: GMO
The idea of significant rallies off severely oversold bear markets is not new. After the sharp decline in the fall of 1929, the S&P 500 rallied 46% from its low in November to the rally high of April 12, 1930. Economic commentary from those days suggested that participants were convinced a new bull market was underway. What followed to the horror of overly optimistic participants was a gut wrenching 80% decline.
10. The Option ARM crisis is real (2010), Commercial Real Estate is real (Capmark), the States Crises is real & the Consumer Is Spent
Stock markets usually lead the economy by 6 to 9 months. It's usually around this time that the economy starts delivering solid economic data. But when you see news items like Citibank raising credit card rates to 29.9% for all clients, you know that all is not well, not with the banks and not with the consumer.
We have yet to see significant improvements to justify the 56% market rebound that we have seen off the lows, so in our view the risks are now clearly to the downside. Market participants are starting to recognize this and stocks that are beating estimates are selling off.
One obvious caveat to our forecast is the Fed. The Fed, the Treasury and US government are committed to pulling out all stops to pull the US out of the Great Recession. But unless new programs are used to address the underlying problems that ail the economy, they are likely to be short term fixes. Further, the action in the dollar and other market action is sending signals that the U.S. will need to be very careful in announcing new programs.
Technicals - Time Price & Pattern Coinciding Suggest A Major Trend Change Is Imminent
The prevailing consensus is that Elliott Wave Theory is for crackpots and cannot be used profitably. Most analysts would agree with that opinion.
However, Elliot Wave (EW) was one of the few technical analyses to predict that the market would have a tremendous rally from the lows. Not only that we were able to exit the market at 682 based on a clearly identifiable pattern completion. While the consensus on EW is that it's a tough strategy to make money with, I'd point out that EW was used by legendary investors like Paul Tudor Jones to forecast and profit from the 1987 crash. More recently, Robert Prechter gained fame with an 800 point forecast shorting the S&P at the top and exiting at 720.
Most particularly, EW is at its most reliable when three factors - time, price and pattern - coincide. At these times, trend change is inevitable. Time will tell obviously as these are interesting times we live in.
1. Time - From October 2007, the S&P has completed a 38% time retrace and will complete a 50% time retrace on November 17th
2. Price - From Octoer 2007, the S&P has completed a 38% price retrace from the March lows and is nearing a 50% price retrace at 1117
3. Pattern - Since the March Lows, the S&P has completed an ABC corrective pattern
In our opinion, EW is forecasting that we are near completion of a multi month trend and an imminent change in direction is coming.

4. October 2007 Trendline Rejection & 5. March 2009 Trendline Break
As you can hopefully see from the chart above, the March 2009 trendline was convincingly broken today. In addition, the S&P 500 was repelled convincingly from a major trend line (Oct 07 to Apr 08) and the volume on the selloff has been larger than in recent weeks. The selloff has also been impulsive, again a strong indicator that we could be in for a change in market character. We remain bearish until the market can convincingly pierce through the major trendline.
Fundamentals
6. Valuation - Analyst estimates for 2010 are overly optimistic

Q3 Earnings for the S&P are currently estimated by Standard & Poors to be around $14.78. This translates to a negative year over year growth of -7.41% versus Q3 of 2008. Now do I need to remind you of where we were in Q3 2008? Does the collapse of Lehman serve as an appropriate benchmark? And even after all the handouts, bailouts, tarp buybacks, and a 50% rally, the S&P 500 hasn't been able to show year over year growth versus a very "easy comparable".
But Wall Street's prescient analysts are forecasting the S&P will grow earnings by 34% in 2010, Consumer Discretionary will grow 58%, Energy 89%, Financials 137%, Tech 30% and Materials by 94%!
We've seen this same story since March 2008. Analysts are overly optimistic. On trailing earnings, using the generous operating earnings measure, the S&P is still at a very pricey 26 times earnings.
7. The Debt Piper Will Need to Be Paid - Julian Robertson, Tiger Capital
What most Wall Street investors are conveniently forgetting is that the U.S. government's bandaid approach to handling crises has created debts that will stay with us at best for a long long time and at worst send us the way that Japan is headed. David Einhorn of Greenlight Capital illustrates it far better than I could:
Japan appears vulnerable, because it is even more indebted and its poor demographics are a decade ahead of ours. Japan may already be past the point of no return. When a country cannot reduce its ratio of debt to GDP over any time horizon, it means it can only refinance, but can never repay its debts. Japan has about 190% debt-to-GDP financed at an average cost of less than 2%. Even with the benefit of cheap financing the Japanese deficit is expected to be 10% of GDP this year. At some point, as American homeowners with teaser interest rates have learned, when the market refuses to refinance at cheap rates, problems quickly emerge. Imagine the fiscal impact of the market resetting Japanese borrowing costs to 5%.8. The Economic Landscape Has Not Confirmed the Market's Rally
Over the last few years, Japanese savers have been willing to finance their government deficit. However, with Japan’s population aging, it’s likely that the domestic savers will begin using those savings to fund their retirements. The newly elected DPJ party that favors domestic consumption might speed up this development. Should the market re-price Japanese credit risk, it is hard to see how Japan could avoid a government default or hyperinflationary currency death spiral...
For years, the discussion has been that U.S. deficit spending will pass the costs onto “our grandchildren.” I believe that this is no longer the case and that the consequences will be seen during the lifetime of the leaders who have pursued short-term popularity over our solvency. The recent economic crisis and our response has brought forward the eventual reconciliation into a window that is near enough that it makes sense for investors to buy some insurance to protect themselves from a possible systemic event. To slightly modify Alexis de Tocqueville: Events can move from the impossible to the inevitable without ever stopping at the probable. As investors, we can’t change the course of events, but we can attempt to protect capital in the face of foreseeable risks.
I won't bore you with the details but there is hardly any evidence of an economic recovery. Most of the earnings beats have been due to cost cutting and playing the Wall Street game of earnings beating "forecasts".
- Declining & downright scary Consumer Confidence numbers the past two months
- Cost cutting to generate earnings today will have impacts in future quarters
- While unemployment is a lagging indicator, jobless claims are coincident and the continued stubborn plus 500k levels of jobless claims each month the past few months are going to have structural impacts in the coming months
9. This rally is more likely a dead cat bounce similar to 1929-30
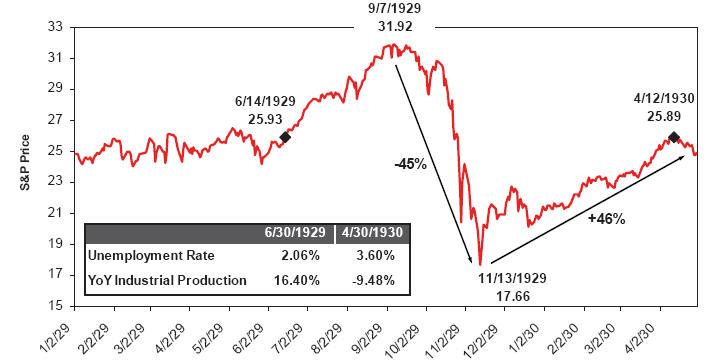
Source: GMO
The idea of significant rallies off severely oversold bear markets is not new. After the sharp decline in the fall of 1929, the S&P 500 rallied 46% from its low in November to the rally high of April 12, 1930. Economic commentary from those days suggested that participants were convinced a new bull market was underway. What followed to the horror of overly optimistic participants was a gut wrenching 80% decline.
10. The Option ARM crisis is real (2010), Commercial Real Estate is real (Capmark), the States Crises is real & the Consumer Is Spent
Stock markets usually lead the economy by 6 to 9 months. It's usually around this time that the economy starts delivering solid economic data. But when you see news items like Citibank raising credit card rates to 29.9% for all clients, you know that all is not well, not with the banks and not with the consumer.
We have yet to see significant improvements to justify the 56% market rebound that we have seen off the lows, so in our view the risks are now clearly to the downside. Market participants are starting to recognize this and stocks that are beating estimates are selling off.
One obvious caveat to our forecast is the Fed. The Fed, the Treasury and US government are committed to pulling out all stops to pull the US out of the Great Recession. But unless new programs are used to address the underlying problems that ail the economy, they are likely to be short term fixes. Further, the action in the dollar and other market action is sending signals that the U.S. will need to be very careful in announcing new programs.
Why Japan Is In Worse Shape Than the U.S.
Another on target analysis and the reason why it makes sense for all investors to protect themselves from an inflationary spiral in the U.S. Secondly, many investors are looking to diversify out of dollars, are Yen really that better a choice? What about the pound or the euro? lots of issues there as well.
Japan appears vulnerable, because it is even more indebted and its poor demographics are a decade ahead of ours. Japan may already be past the point of no return. When a country cannot reduce its ratio of debt to GDP over any time horizon, it means it can only refinance, but can never repay its debts. Japan has about 190% debt-to-GDP financed at an average cost of less than 2%. Even with the benefit of cheap financing the Japanese deficit is expected to be 10% of GDP this year. At some point, as American homeowners with teaser interest rates have learned, when the market refuses to refinance at cheap rates, problems quickly emerge. Imagine the fiscal impact of the market resetting Japanese borrowing costs to 5%.
Over the last few years, Japanese savers have been willing to finance their government deficit. However, with Japan’s population aging, it’s likely that the domestic savers will begin using those savings to fund their retirements. The newly elected DPJ party that favors domestic consumption might speed up this development. Should the market re-price Japanese credit risk, it is hard to see how Japan could avoid a government default or hyperinflationary currency death spiral.
For years, the discussion has been that our deficit spending will pass the costs onto “our grandchildren.” I believe that this is no longer the case and that the consequences will be seen during the lifetime of the leaders who have pursued short-term popularity over our solvency. The recent economic crisis and our response has brought forward the eventual reconciliation into a window that is near enough that it makes sense for investors to buy some insurance to protect themselves from a possible systemic event. To slightly modify Alexis de
Tocqueville: Events can move from the impossible to the inevitable without ever stopping at
the probable. As investors, we can’t change the course of events, but we can attempt to protect
capital in the face of foreseeable risks.
Tuesday, October 27, 2009
Time Cycles & Trend Lines Suggest a Trend Change
The S&P 500 has been repelled convincingly from a major trend line (Oct 07 to Apr 08) and the volume on the selloff has been larger than in recent weeks. Further the selloff has been impulsive.
Secondly the rally just recently surpassed the 38.1% time cycle from the Major top in October 2007 and is coming up on the 50% retracement. In addition, the market tried to approach the 50% price retrace, came close and was repelled strongly.
Finally the wave structure seems to suggest that we may have completed an ABC rally from the March 2009 lows.
All strong factors that could be signalling a trend change. But I learnt a long time ago that it is far better to let the market tell you when the trend has changed rather than forming my expectations.
My Portfolio is net short going forward and will be looking to short rallies.
A market move above 1120 will cause me to strongly revise my thesis.
Fundamentally the market also appears to have realized that the green shoots exist in the minds of bulls only. The market has also done an admirable job of convincing most participants that a recovery is underway, precisely the conditions necessary for a selloff.
Subscribe to:
Posts (Atom)