Even though I'm not a technician by trade, I must begin with technicals because fundamentals have not driven this market rally. In my opinion, this has been a speculative, technical bounce similar to past rallies off severely oversold conditions especially involving the Fed and loose monetary policy.
Technicals - Time Price & Pattern Coinciding Suggest A Major Trend Change Is Imminent
The prevailing consensus is that Elliott Wave Theory is for crackpots and cannot be used profitably. Most analysts would agree with that opinion.
However, Elliot Wave (
EW) was one of the few technical analyses to predict that the market would have a tremendous rally from the lows. Not only that we were able to exit the market at 682 based on a clearly identifiable pattern completion. While the consensus on EW is that it's a tough strategy to make money with, I'd point out that EW was used by legendary investors like Paul Tudor Jones to forecast and profit from the 1987 crash. More recently, Robert Prechter gained fame with an 800 point forecast shorting the S&P at the top and exiting at 720.
Most particularly, EW is at its most reliable when three factors - time, price and pattern - coincide. At these times, trend change is inevitable. Time will tell obviously as these are interesting times we live in.
1. Time - From October 2007, the S&P has completed a 38% time retrace and will complete a 50% time retrace on November 17th
2. Price - From Octoer 2007, the S&P has completed a 38% price retrace from the March lows and is nearing a 50% price retrace at 1117
3. Pattern - Since the March Lows, the S&P has completed an ABC corrective pattern
In our opinion, EW is forecasting that we are near completion of a multi month trend and an imminent change in direction is coming.
4. October 2007 Trendline Rejection &
5. March 2009 Trendline Break
As you can hopefully see from the chart above, the March 2009 trendline was convincingly broken today. In addition, the S&P 500 was repelled convincingly from a major trend line (Oct 07 to Apr 08) and the volume on the selloff has been larger than in recent weeks. The selloff has also been impulsive, again a strong indicator that we could be in for a change in market character. We remain bearish until the market can convincingly pierce through the major trendline.
Fundamentals
6. Valuation -
Analyst estimates for 2010 are overly optimistic
Q3 Earnings for the S&P are currently estimated by Standard & Poors to be around $14.78. This translates to a negative year over year growth of -7.41% versus Q3 of 2008. Now do I need to remind you of where we were in Q3 2008? Does the collapse of Lehman serve as an appropriate benchmark? And even after all the handouts, bailouts, tarp buybacks, and a 50% rally, the S&P 500 hasn't been able to show year over year growth versus a very "easy comparable".
But Wall Street's prescient analysts are forecasting the S&P will grow earnings by 34% in 2010, Consumer Discretionary will grow 58%, Energy 89%, Financials 137%, Tech 30% and Materials by 94%!
We've seen this same story since March 2008. Analysts are overly optimistic. On trailing earnings, using the generous operating earnings measure, the S&P is still at a very pricey 26 times earnings.
7. The Debt Piper Will Need to Be Paid - Julian Robertson, Tiger Capital
What most Wall Street investors are conveniently forgetting is that the U.S. government's bandaid approach to handling crises has created debts that will stay with us at best for a long long time and at worst send us the way that Japan is headed.
David Einhorn of Greenlight Capital illustrates it far better than I could:
Japan appears vulnerable, because it is even more indebted and its poor demographics are a decade ahead of ours. Japan may already be past the point of no return. When a country cannot reduce its ratio of debt to GDP over any time horizon, it means it can only refinance, but can never repay its debts. Japan has about 190% debt-to-GDP financed at an average cost of less than 2%. Even with the benefit of cheap financing the Japanese deficit is expected to be 10% of GDP this year. At some point, as American homeowners with teaser interest rates have learned, when the market refuses to refinance at cheap rates, problems quickly emerge. Imagine the fiscal impact of the market resetting Japanese borrowing costs to 5%.
Over the last few years, Japanese savers have been willing to finance their government deficit. However, with Japan’s population aging, it’s likely that the domestic savers will begin using those savings to fund their retirements. The newly elected DPJ party that favors domestic consumption might speed up this development. Should the market re-price Japanese credit risk, it is hard to see how Japan could avoid a government default or hyperinflationary currency death spiral...
For years, the discussion has been that U.S. deficit spending will pass the costs onto “our grandchildren.” I believe that this is no longer the case and that the consequences will be seen during the lifetime of the leaders who have pursued short-term popularity over our solvency. The recent economic crisis and our response has brought forward the eventual reconciliation into a window that is near enough that it makes sense for investors to buy some insurance to protect themselves from a possible systemic event. To slightly modify Alexis de Tocqueville: Events can move from the impossible to the inevitable without ever stopping at the probable. As investors, we can’t change the course of events, but we can attempt to protect capital in the face of foreseeable risks.
8. The Economic Landscape Has Not Confirmed the Market's Rally
I won't bore you with the details but there is hardly any evidence of an economic recovery. Most of the earnings beats have been due to cost cutting and playing the Wall Street game of earnings beating "forecasts".
- Declining & downright scary Consumer Confidence numbers the past two months
- Cost cutting to generate earnings today will have impacts in future quarters
- While unemployment is a lagging indicator, jobless claims are coincident and the continued stubborn plus 500k levels of jobless claims each month the past few months are going to have structural impacts in the coming months
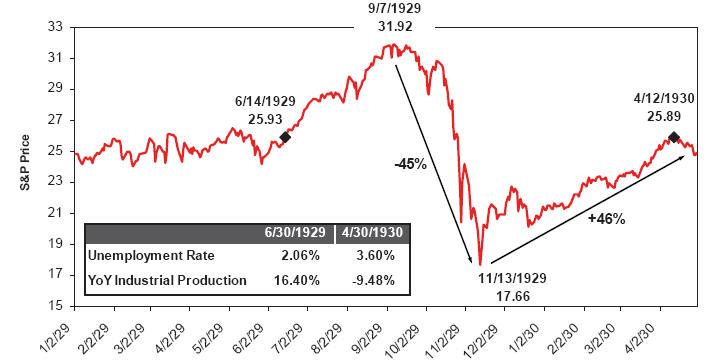
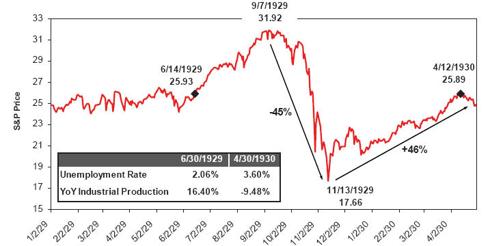
9. This rally is more likely a dead cat bounce similar to 1929-30
Source: GMO
The idea of significant rallies off severely oversold bear markets is not new. After the sharp decline in the fall of 1929, the S&P 500 rallied 46% from its low in November to the rally high of April 12, 1930. Economic commentary from those days suggested that participants were convinced a new bull market was underway. What followed to the horror of overly optimistic participants was a gut wrenching 80% decline.
10. The Option ARM crisis is real (2010), Commercial Real Estate is real (Capmark), the States Crises is real & the Consumer Is Spent
Stock markets usually lead the economy by 6 to 9 months. It's usually around this time that the economy starts delivering solid economic data. But when you see news items like Citibank raising credit card rates to 29.9% for all clients, you know that all is not well, not with the banks and not with the consumer.
We have yet to see significant improvements to justify the 56% market rebound that we have seen off the lows, so in our view the risks are now clearly to the downside. Market participants are starting to recognize this and stocks that are beating estimates are selling off.
One obvious caveat to our forecast is the Fed. The Fed, the Treasury and US government are committed to pulling out all stops to pull the US out of the Great Recession. But unless new programs are used to address the underlying problems that ail the economy, they are likely to be short term fixes. Further, the action in the dollar and other market action is sending signals that the U.S. will need to be very careful in announcing new programs.