| Type | Date/Time | Symbol | Price | Shares/Ctrts | Net Profit |
| Profit | Cum Net Profit | ||||
| Buy | 10/23/09 15:32 | DIW WJ | $2.85 | 10 | $150.00 |
| Sell | 10/26/09 11:40 | DIW WJ | $3.00 | 150 | $150.00 |
| Buy | 10/26/09 11:14 | TZA | $11.60 | 1000 | $510.00 |
| Sell | 10/26/09 11:55 | TZA | $12.11 | 510 | $660.00 |
| Buy | 10/23/09 13:49 | ERY | $11.20 | 1000 | $170.00 |
| Sell | 10/26/09 12:00 | ERY | $11.37 | 170 | $830.00 |
| Buy | 10/26/09 11:16 | TZA | $11.66 | 1000 | $600.00 |
| Sell | 10/26/09 12:00 | TZA | $12.26 | 600 | $1,430.00 |
| Buy | 10/26/09 11:37 | TZA | $12.10 | 1000 | $150.00 |
| Sell | 10/26/09 12:02 | TZA | $12.25 | 150 | $1,580.00 |
| Buy | 10/26/09 11:37 | TZA | $12.10 | 1000 | $150.00 |
| Sell | 10/26/09 12:02 | TZA | $12.25 | 150 | $1,730.00 |
| Buy | 10/23/09 15:32 | DIW WJ | $2.85 | 10 | $350.00 |
| Sell | 10/26/09 12:02 | DIW WJ | $3.20 | 350 | $2,080.00 |
| Buy | 10/26/09 11:20 | DIW WJ | $2.50 | 10 | $700.00 |
| Sell | 10/26/09 12:02 | DIW WJ | $3.20 | 700 | $2,780.00 |
| Buy | 10/26/09 12:22 | TZA | $12.27 | 1000 | $50.00 |
| Sell | 10/26/09 13:21 | TZA | $12.32 | 50 | $2,830.00 |
| Buy | 10/26/09 15:53 | ERY | $11.65 | 1000 | $120.00 |
| Sell | 10/26/09 18:55 | ERY | $11.77 | 120 | $2,950.00 |
| Buy | 10/26/09 15:50 | TZA | $12.30 | 1000 | $190.00 |
| Sell | 10/27/09 13:00 | TZA | $12.49 | 190 | $3,140.00 |
| Buy | 10/26/09 15:56 | DIW WJ | $3.35 | 10 | $200.00 |
| Sell | 10/27/09 13:44 | DIW WJ | $3.55 | 200 | $3,340.00 |
| Buy | 10/27/09 10:51 | DIW WJ | $3.30 | 10 | $250.00 |
| Sell | 10/27/09 13:44 | DIW WJ | $3.55 | 250 | $3,590.00 |
| Buy | 10/27/09 11:16 | DIW WJ | $3.40 | 30 | $450.00 |
| Sell | 10/27/09 13:44 | DIW WJ | $3.55 | 450 | $4,040.00 |
| Buy | 10/27/09 13:05 | GFA | $33.04 | 250 | ($147.50) |
| Sell | 10/27/09 14:00 | GFA | $32.45 | -147.5 | $3,892.50 |
| Buy | 10/27/09 10:52 | TZA | $12.39 | 500 | $190.00 |
| Sell | 10/27/09 15:53 | TZA | $12.77 | 190 | $4,082.50 |
| Buy | 10/27/09 11:04 | TWM | $29.13 | 500 | $295.00 |
| Sell | 10/27/09 15:54 | TWM | $29.72 | 295 | $4,377.50 |
| Sell Short | 10/27/09 10:54 | IRE | $13.11 | 150 | $441.00 |
| Buy to Cover | 10/28/09 11:41 | IRE | $10.17 | 441 | $4,818.50 |
| Buy | 10/27/09 17:28 | EDZ | $6.49 | 500 | $320.00 |
| Sell | 10/28/09 11:43 | EDZ | $7.13 | 320 | $5,138.50 |
| Buy | 10/27/09 10:52 | TZA | $12.39 | 500 | $530.00 |
| Sell | 10/28/09 11:43 | TZA | $13.45 | 530 | $5,668.50 |
| Buy | 10/26/09 15:59 | FAZ | $20.70 | 500 | $765.00 |
| Sell | 10/28/09 11:43 | FAZ | $22.23 | 765 | $6,433.50 |
| Buy | 10/27/09 15:50 | SMN | $10.56 | 500 | $300.00 |
| Sell | 10/28/09 11:43 | SMN | $11.22 | 300 | $6,733.50 |
| Buy | 10/27/09 10:35 | ERY | $11.41 | 500 | $295.00 |
| Sell | 10/28/09 11:44 | ERY | $12.00 | 295 | $7,028.50 |
| Buy | 10/27/09 15:49 | SRS | $10.06 | 500 | $240.00 |
| Sell | 10/28/09 11:44 | SRS | $10.54 | 240 | $7,268.50 |
| Buy | 10/21/09 12:54 | QID | $21.50 | 250 | $447.50 |
| Sell | 10/28/09 11:45 | QID | $23.29 | 447.5 | $7,716.00 |
| Buy | 10/27/09 10:35 | ERY | $11.41 | 500 | $315.00 |
| Sell | 10/28/09 12:01 | ERY | $12.04 | 315 | $8,031.00 |
| Buy | 10/27/09 17:28 | EDZ | $6.49 | 500 | $350.00 |
| Sell | 10/28/09 13:24 | EDZ | $7.19 | 350 | $8,381.00 |
| Buy | 10/27/09 14:11 | TZA DF | $5.70 | 10 | $700.00 |
| Sell | 10/28/09 14:26 | TZA DF | $6.40 | 700 | $9,081.00 |
| Buy | 10/28/09 15:40 | TZA | $14.17 | 1000 | ($90.00) |
| Sell | 10/28/09 15:46 | TZA | $14.08 | -90 | $8,991.00 |
| Buy | 10/28/09 11:55 | GFA | $29.49 | 100 | $141.00 |
| Sell | 10/29/09 11:05 | GFA | $30.90 | 141 | $9,132.00 |
| Buy | 10/27/09 16:06 | NFLX | $54.29 | 100 | $890.00 |
| Sell | 10/29/09 11:05 | NFLX | $55.18 | 890 | $10,022.00 |
| Buy | 10/27/09 17:20 | PZG | $1.28 | 1000 | ($60.00) |
| Sell | 10/29/09 11:06 | PZG | $1.22 | -60 | $9,962.00 |
| Buy | 10/20/09 12:53 | NGD | $4.17 | 500 | ($220.00) |
| Sell | 10/29/09 11:07 | NGD | $3.73 | -220 | $9,742.00 |
| Buy | 10/21/09 11:45 | NGD | $4.28 | 500 | ($275.00) |
| Sell | 10/29/09 11:07 | NGD | $3.73 | -275 | $9,467.00 |
| Buy | 10/28/09 13:28 | V | $77.33 | 100 | ($10.00) |
| Sell | 10/29/09 11:17 | V | $77.23 | -10 | $9,457.00 |
| Buy | 10/28/09 13:20 | GFA | $29.89 | 50 | $70.50 |
| Sell | 10/29/09 11:17 | GFA | $31.30 | 70.5 | $9,527.50 |
| Buy | 10/29/09 13:04 | SPY | $106.23 | 250 | $0.00 |
| Sell | 10/29/09 13:04 | SPY | $106.23 | 0 | $9,527.50 |
| Buy | 10/29/09 11:03 | TWM | $30.44 | 250 | $15.00 |
| Sell | 10/29/09 13:05 | TWM | $30.50 | 15 | $9,542.50 |
| Buy | 10/28/09 13:31 | ENTR | $2.85 | 1000 | ($60.00) |
| Sell | 10/29/09 13:27 | ENTR | $2.79 | -60 | $9,482.50 |
| Buy | 10/21/09 11:45 | NGD | $4.28 | 1000 | ($490.00) |
| Sell | 10/29/09 15:51 | NGD | $3.79 | -490 | $8,992.50 |
| Buy | 10/29/09 11:01 | FAZ | $21.57 | 500 | $50.00 |
| Sell | 10/30/09 11:36 | FAZ | $21.67 | 50 | $9,042.50 |
| Buy | 10/29/09 13:45 | FAZ | $20.83 | 250 | $252.50 |
| Sell | 10/30/09 11:37 | FAZ | $21.84 | 252.5 | $9,295.00 |
| Buy | 10/29/09 11:00 | EDZ | $6.70 | 1000 | $400.00 |
| Sell | 10/30/09 11:39 | EDZ | $7.10 | 400 | $9,695.00 |
| Buy | 10/29/09 10:58 | TZA | $13.36 | 500 | $245.00 |
| Sell | 10/30/09 11:39 | TZA | $13.85 | 245 | $9,940.00 |
| Buy | 10/29/09 11:24 | KRE XE | $4.40 | 10 | $100.00 |
| Sell | 10/30/09 11:40 | KRE XE | $4.50 | 100 | $10,040.00 |
| Buy | 10/29/09 11:00 | EDZ | $6.70 | 500 | $210.00 |
| Sell | 10/30/09 12:11 | EDZ | $7.12 | 210 | $10,250.00 |
| Buy | 10/29/09 10:58 | TZA | $13.36 | 500 | $235.00 |
| Sell | 10/30/09 12:11 | TZA | $13.83 | 235 | $10,485.00 |
| Buy | 10/30/09 12:17 | SPXU | $45.29 | 500 | $180.70 |
| Sell | 10/30/09 12:37 | SPXU | $45.65 | 180.7 | $10,665.70 |
| Buy | 10/29/09 11:00 | EDZ | $6.70 | 500 | $280.00 |
| Sell | 10/30/09 12:37 | EDZ | $7.26 | 280 | $10,945.70 |
| Buy | 10/29/09 12:56 | EDZ | $6.52 | 500 | $370.00 |
| Sell | 10/30/09 12:37 | EDZ | $7.26 | 370 | $11,315.70 |
| Buy | 10/29/09 11:03 | TWM | $30.44 | 50 | $610.00 |
| Sell | 10/30/09 12:37 | TWM | $31.66 | 610 | $11,925.70 |
| Buy | 10/29/09 13:05 | TWM | $30.51 | 250 | $287.50 |
| Sell | 10/30/09 12:37 | TWM | $31.66 | 287.5 | $12,213.20 |
| Sell Short | 10/27/09 11:21 | WYNN | $57.51 | 100 | $326.00 |
| Buy to Cover | 10/30/09 12:37 | WYNN | $54.25 | 326 | $12,539.20 |
| Buy | 10/29/09 12:56 | TZA | $13.18 | 500 | $420.00 |
| Sell | 10/30/09 12:37 | TZA | $14.02 | 420 | $12,959.20 |
| Sell Short | 10/27/09 10:54 | IRE | $13.11 | 100 | $275.00 |
| Buy to Cover | 10/30/09 12:38 | IRE | $10.36 | 275 | $13,234.20 |
| Sell Short | 10/29/09 11:08 | IRE | $10.81 | 50 | $22.50 |
| Buy to Cover | 10/30/09 12:38 | IRE | $10.36 | 22.5 | $13,256.70 |
| Buy | 10/29/09 12:56 | TZA | $13.18 | 500 | $525.00 |
| Sell | 10/30/09 13:16 | TZA | $14.23 | 525 | $13,781.70 |
| Buy | 10/29/09 12:56 | EDZ | $6.52 | 500 | $395.00 |
| Sell | 10/30/09 13:16 | EDZ | $7.31 | 395 | $14,176.70 |
| Buy | 10/29/09 13:59 | EDZ | $6.48 | 500 | $415.00 |
| Sell | 10/30/09 13:16 | EDZ | $7.31 | 415 | $14,591.70 |
| Sell Short | 10/29/09 11:08 | WYNN | $56.93 | 50 | $158.00 |
| Buy to Cover | 10/30/09 13:16 | WYNN | $53.77 | 158 | $14,749.70 |
| Buy | 10/30/09 13:53 | QQQ KP | $0.70 | 10 | ($40.00) |
| Sell | 10/30/09 15:48 | QQQ KP | $0.66 | -40 | $14,709.70 |
Saturday, October 31, 2009
Performance - Trades
Reasons For Bearishness Continue - Oct 31, 2009
1. Technical Breakdown The S&P 500 is riding a four-day losing streak. And while we have seen these corrections turn around before during this massive bear market rally that started last March, the difference this time is that the uptrend line from the lows has been violated across a fairly broad front, including the S&P 500, Nasdaq and the Russell 2000. When trend lines get violated, and when this happens on high volume, it usually, though not always, signals something big.
2. Valuation In terms of valuation, we said yesterday that the P/E ratio on the S&P 500 on a normalized 10-year basis is 22x and the long-turn norm is 16x. Just to go back to the norm, let alone compress to a level commensurate with an unusually high level of economic and financial uncertainty, would suggest that we would see the S&P correct down towards 860.
3. Fannie Mae: Delinquencies Increase Sharply in August
Fannie Mae reported today that the rate of serious delinquencies - at least 90 days behind - for conventional loans in its single-family guarantee business increased to 4.45% in August, up from 4.17% in July - and up from 1.57% in August 2008.
We are back in the bubble years offering zero down payment homes, 125% LTV loans to unsuspecting first time home buyers. Yet another case of trying to create a bubble to solve our problems.
4. Courtesy ZeroHedge - CRE Crash & Implied Lack of Fed Support Will Hurt Bank Balance Sheets
In what could have been the biggest piece of news today, yet making little headway into the media, the Fed announced that it is adopting a policy statement supporting "prudent commercial real estate loan workouts."
The Fed seems to now be encouraging active loan workouts as a matter of policy. The other implication is that firms with CRE exposure can no longer rely on the Fed as a perpetual guarantor of risky exposure. Not only that, but in adopting a new policy strategy, the Fed is acknowledging the major problem that CRE writedowns will represent for banks, yet is telling banks to resolve problems on their own, while subsequently they will "not be subject to criticism for engaging in these efforts."
The implications of this Fed action for the economy could be staggering as the $3.5 b,quadr,trillion CRE market will likely not receive the same largesse that residential real estate has been the recipient of ever since the conservatorship of the GSEs. And the biggest loser in all of this will be banks that still have not used the massive risk rally to offload whole loan and CMBS CRE holdings, and moreover, still have these marked at par or close thereby.
As Wilbur Ross and George Soros pointed out earlier, the trouble for CRE is just starting. If the Fed is unwilling to recreate QE for CRE, in the same way that it continues to bail out residential exposure, then look for a major double dip in the economy. The only wild card is why the Fed is letting this happen, although if the political backlash against just QE 1 is any indication, then it likely would not have been able to pass additional liquidity measures regardless.
5. And out of the Economist, America’s debt crisis will be chronic, not acute
AS AMERICA’S financial crisis recedes, the rumblings of its next crisis can be heard. The federal government has wrapped its guarantees around banks and the housing market. It has borrowed hundreds of billions of dollars to stimulate the enfeebled economy, while tax revenues crumble. And in the years to come the cost of retirees’ benefits will explode. “There is every reason to worry that the banking crisis has simply morphed into a long-term government-debt crisis,” says Kenneth Rogoff of Harvard University.
The Treasury’s ravenous borrowing needs also leave lots of opportunities for something to go wrong. In the past two years the portion of its debt maturing in less than a year has jumped from 30% to over 40%, the most since the early 1980s
In the fiscal year that ended on September 30th the Treasury held an auction on average more than once a day to finance nearly $7 trillion of new and maturing debt. A failure to raise as much money at an auction as planned—as occurred in Britain earlier this year—could send a shudder through global financial markets. “Other countries can afford a failed auction; we can’t,” says Lou Crandall, chief economist at Wrightson ICAP, a financial-research firm. “What do you do when there is a confidence shock to your flight-to-safety asset?”
6. Number of Vacant Homes Rising Again
The US Census Bureau has released its Third Quarter report on Residential Vacancies and Homeownership. As can be seen from the attached chart, the number of vacant homes in Q3 has started increasing once again after posting moderate improvements over the prior two quarters, and is now at 18.8 million units, rising from 18.4 million in the prior year. With new home sales surprising to the downside, look for this number to continue increasing into the fourth quarter. Notable is that the rental vacancy rate stood at an all time high of 11.1%. As James Lockhart, former director of the FHFA which he singlehandedly managed to destroy said: "We are bumping along the bottom of the housing market. There is the potential for another swing down." Don't tell that to the GDP numbers.
Are You A Child of the Bubble?
Many investors – as well those in charge - have grown up without knowing or experiencing anything but a bull market in the U.S. Since the 1950s America has been dominant and the expectation is that this dominance will continue. As a result our leaders have made and continue to make choices that assume the continuation of trends of the past years. Sadly, this is a reason why this recession and its consequences will last with us for a long time.
Let’s review some of the economic challenges that still lie ahead of us.
Option ARMs are a disaster – 30 day + delinquincies are reaching close to 50% of all outstanding option ARMs. The St. Louis Fed has stated that they were concerned about Option Arm and Alt-A loan delinquency rates. Delinquencies have moved steadily higher with the 30 day + delinquency now reaching close to 50% of all outstanding Option Arms.
The thing about these products is that the minimum payment is at times less than half what a fully amortizing normal payment would be and the borrowers that chose these did so in the past few years and are now sitting on negative equity. Loan modifications are not feasible in almost any scenario and the incentive is to walk away. Housing has not bottomed by a long shot.
Sentiment Is Dipping .. came out of Gallup yesterday
Sentiment about the economy is starting to backslide, after a brief tip up.
Fifty-eight percent of those polled say the economic slide still has a ways to go, up from 52% in September and back to the level of pessimism expressed in July. Only 29% said the economy had "pretty much hit bottom," down from 35% last month.
64% said the rise of the Dow Jones Industrial Average didn't have much impact on their views of the economy. Just 42% said the economy will get better in the next 12 months, down from 47% in September. In contrast, 22% said things would get worse, up from 20%.
Bottom line, consumers are not feeling more confident about the recovery because they have not participated in the recovery. The recovery has been driven by stimulus money which is finding its way into the banks and bonuses. Does a 30%+ jump in Hamptons sales tell you where the money is headed? It also explains why New York city has held up relatively well compared to the rest of the country. But New York and Wall Street are not the economy.
We Just Had the 3rd lowest sales for September since the Census Bureau started tracking sales in 1963
Calculated Risk reports on New Home Sales. The Census Bureau reports New Home Sales in September were at a seasonally adjusted annual rate (SAAR) of 402 thousand. This is a decrease from the revised rate of 417 thousand in August (revised from 429 thousand).
Even uber-bearish housing analyst Mark Hanson was taken aback by the shortfall in home sales this morning. Even he thought that the remaining homebuyer tax credit, plus all the other stimulus out there, would produce a rise in new home sales.
But no. September was the worst month since 1981.
Permanent Bailouts for the Top 20 Banks?
Paul Volcker and senior Harvard economist Jeffrey Miron both testified to Congress this week that the government is trying to make bailouts for the giant banks permanent.
Writing Wednesday in The Hill, Congressman Brad Sherman pointed out that :
In my opinion, Geithner’s proposal is “TARP on steroids.” Section 1204 of the proposal [the proposal being the "Resolution Authority for Large, Interconnected Financial Companies Act of 2009"] allows the executive branch to use taxpayer money to make loans to, or invest in, the largest financial institutions to avoid a systemic risk to the economy.
TARP was limited to two years, and to a maximum of $700 billion. Section 1204 is unlimited in dollar amount and is a permanent grant of power to the executive branch.
When I asked Geithner whether he would accept a $1 trillion limit on the new bailout authority (if the executive branch wanted to spend more, it would have to come back to Congress), he rejected a $1 trillion limit, insisting that the executive branch be able to respond without coming back to Congress.
That is a huge gravy train to the top 20 [financial institutions] because it allows them to borrow money at a lower rate. Think of what this does to moral hazard.
A sustainable recovery with 530,000 weekly claims?
That’s what we seem to be expecting based on the huge uptick in equities since March. While stock markets have long since moved it up a gear, the employment market is stuck in neutral. The latest seasonally-adjusted jobless claims numbers came in at 530,000. The widely-followed four week average is still 526,250 and is not coming down.
Global Economies Are Not Doing Any Better – Greece Downgraded
Last week, Fitch downgraded Greece's foreign and local currency ratings from A to A- due to a ballooning deficit that has spiraled out of control.
Now, Moody's is also considering a cut for Greece. It's an understandable move, considering that Greece's increasing deficit is already 12.5% of its GDP.
Moody's: "The deterioration of the fiscal position raises serious questions about the sustainability of Greek public finances and the problem will be compounded by a less favourable global economic environment going forward," says Arnaud Marès, a Senior Vice President in Moody's Sovereign Risk Group.
Friday, October 30, 2009
Thursday, October 29, 2009
Core Principles
You Cannot Borrow Yourself Out Of A Debt Crisis
You cannot borrow your way out of a debt crisis. Yes, you may be able to destroy the value of the currency by being more reckless than a drunken sailor, but you cannot create prosperity by borrowing from Dick to pay Harry and then borrowing from Jane to pay Dick, etc. We are creating another tower of debt in the public sector to replace the collapsing tower of debt in the private sector.
No Fiat Money System Has Ever Survived Temptation
In the history of fiat or government-produced paper money, no fiat money in history has ever survived, all are now museum pieces. The reason is that fiat money is produced (without the discipline of gold) in any quantities a government desires. When an economy slows (as now) or when a nation goes to war (which is always wildly expensive, as now) the temptation to print the needed "wealth" becomes overwhelming.
Eventually, the world distrusts man-made "money." In the end, each new issue of fiat money dies. The fate of the US dollar will be no different. Which is the real reason why we hold gold for the long-term.
Gold & Treasury Bubbles
We are in the midst of yet another bubble yet it's very difficult to recognize bubbles until they burst. No, the bubble isn't Gold, it's U.S. Treasuries.
John Paulson presented a simple, but compelling case for Gold. First, the monetary base has exploded in a way we've never seen before. The monetary base is essentially the Federal Reserve Bank's currency and reserves. The Fed, by buying up securities in this crisis, has pumped a lot of money into the economy.
As Paulson explained, that's because this base money has not yet been lent out and multiplied throughout the economy. Yet the monetary base and money supply are highly correlated, "almost 1-to-1 between the two," Paulson said.
That means that as the monetary base expands, the money supply surely follows, though there is a lag. (Money supply is a broader measure of money than just the monetary base, as it includes personal deposits and more. The monetary base is like a kind of monetary yeast. It makes money supply rise.)
If money supply grows faster than the economy, that will create inflation, says Paulson. As it is impossible for the economy to grow anywhere near that vertical spike in the monetary base, Paulson contends inflation is coming.
The U.S. is not alone in its money-printing exercise. The supply of most currencies is expanding rapidly – even the normally tame Swiss franc. In the race of paper currencies, they are all dogs. Hence Paulson's interest in gold, which no government can make on a whim.
Therefore, in the context of the exploding monetary base, gold seems relatively cheap. In other words, as the money supply rises, so does the price of gold, eventually. As a result, says Paulson, "gold has been a perfect hedge against inflation."
There is some slippage over time. The gold price can change faster or slower than the money supply. But when the market gets worried about inflation, the gold price usually changes much faster – as happened in the 1970s. In 1973 – to pick a typical year – inflation was 9% and gold rose 67%. That was a pattern common in the 1970s.
The potential for inflation this time around is greater than it was in the 1970s, given that the growth in the monetary base is so much greater than it was in the 1970s. Gold could do much better this time around, reaching "$3,000 or $4,000, or $5,000 per ounce" as Paulson said.
Future historians will look back at the present day and see clearly how this unfolded. They will see the litany of news items that pointed to the dollar losing its top perch: China and Brazil are settling up trade in their own currencies. The Russians and others are openly calling for a new monetary standard. Even mainstream outlets are discussing alternatives to a dollar-based standard, a province once solely occupied by cranks and gold bugs. Not a week goes by without these kinds of stories.
The gold supply, too, is limited against the vast pool of dollars. As Paulson points out, global money supply is 72 times the value of gold. I'm betting that gap will narrow. It only has to narrow a smidgen and the gold price flies.
As Grant eloquently put it: "Gold is a speculation. But it is a speculation on a certainty: the debasement of the currency." Gold stocks, too, are a speculation. But they are a speculation on an inevitably higher gold price.
A leveraged play on Gold are the small cap Gold Miners. Miners benefit from the inflationary pricing trends in the price of Gold while also benefiting from the deflationary trends in the production and mining of Gold.
Currently I'm Long New Gold NGD, Aurizon Mines & Newmont Mining, as well as the GDX.
Short S&P Small Cap, Financials, Russell 2000
Re-entering Shorts post GDP bounce, there may be stability into the month end, rebuilding short positions in Financials, Russell 2000 and Small Caps.
1982 Vs 2009: Recovery Statistics
Is the current rally the onset of a sustainable secular bull market as we had coming off the fundamental lows of prior bear phases, such as August 1982, when:
• Dividend yields were 6%, not sub-2%.
• Price-to-earnings multiples were 8x, not 26x.
• The market traded at book value, not over two times book.
• Inflation and bond yields were in double digits and headed down in the future, not near-zero and only headed higher.
• The stock market competed with 18% cash rates, not zero, and as such had a much higher hurdle to clear.
• Sentiment was universally bearish; hardly the case today.
• Global trade flows were in the process of accelerating as barriers were taken down; today, we are seeing trade flows recede as frictions, disputes and tariffs become the order of the day.
• A Reagan-led movement was afoot to reduce the role of government with attendant productivity gains in the future; as opposed to the infiltration by the public sector into the capital markets, union sector, economy and of course, the realm of CEO compensation
Indian Stock Market : Oswal Cautions Indian Investors
Interesting to see some high profile investors are starting to issue warning signals on the Indian markets. Local Indian participants are blaming this on the RBI's decision to start tightening, but regardless of what the majority of Indian investors may believe, the Indian market remains a leveraged play on U.S. equities. The selloff in global markets originated in the U.S. and made it's way over to Asian markets. Despite conventional wisdom, Indian equity markets continue to be coupled with the global economy.
Indian equity markets may see a sharp fall any time soon as corporate earnings fail to match up to the investors' expectations, making shares increasingly expensive for buyers, Motilal Oswal, Chairman and Managing Director of Motilal Oswal Financial Services Ltd, said.
Oswal said two of the biggest concerns for inventors in Indian stock market are the government's fiscal deficit and a likely flare-up in wholesale price inflation.
Fiscal deficit, the difference between the government's total spending and revenues, is expected at 6.8% of the gross domestic product for the current year. The government was committed to bringing down its fiscal deficit to 3% of GDP by 2008-09, but ended the year with a deficit of 6%. Aggressive spending to their economies, even as revenues plummeted, has led to yawning fiscal gap in most countries.
A high fiscal deficit would mean that the government makes greater provisioning in budget for debt servicing, instead of spending on physical and social infrastructure. Increased market borrowings by the government to bridge the deficit can lead to credit squeeze and put pressure on interest rates.
"Inflation is a big concern for the market. We think it (wholesale price inflation) will cross 5-6% by early 2010. Whenever inflation sustains at these levels, market usually tanks," Oswal said. "That will be the time when the government may start rolling back the stimulus," he said. The government has said the economic and fiscal stimulus given in the past year will continue at least until the end of the current year.
Wednesday, October 28, 2009
Ten Reasons This Market Has Peaked Or Close to Peaking
Even though I'm not a technician by trade, I must begin with technicals because fundamentals have not driven this market rally. In my opinion, this has been a speculative, technical bounce similar to past rallies off severely oversold conditions especially involving the Fed and loose monetary policy.
Technicals - Time Price & Pattern Coinciding Suggest A Major Trend Change Is Imminent
The prevailing consensus is that Elliott Wave Theory is for crackpots and cannot be used profitably. Most analysts would agree with that opinion.
However, Elliot Wave (EW) was one of the few technical analyses to predict that the market would have a tremendous rally from the lows. Not only that we were able to exit the market at 682 based on a clearly identifiable pattern completion. While the consensus on EW is that it's a tough strategy to make money with, I'd point out that EW was used by legendary investors like Paul Tudor Jones to forecast and profit from the 1987 crash. More recently, Robert Prechter gained fame with an 800 point forecast shorting the S&P at the top and exiting at 720.
Most particularly, EW is at its most reliable when three factors - time, price and pattern - coincide. At these times, trend change is inevitable. Time will tell obviously as these are interesting times we live in.
1. Time - From October 2007, the S&P has completed a 38% time retrace and will complete a 50% time retrace on November 17th
2. Price - From Octoer 2007, the S&P has completed a 38% price retrace from the March lows and is nearing a 50% price retrace at 1117
3. Pattern - Since the March Lows, the S&P has completed an ABC corrective pattern
In our opinion, EW is forecasting that we are near completion of a multi month trend and an imminent change in direction is coming.

4. October 2007 Trendline Rejection & 5. March 2009 Trendline Break
As you can hopefully see from the chart above, the March 2009 trendline was convincingly broken today. In addition, the S&P 500 was repelled convincingly from a major trend line (Oct 07 to Apr 08) and the volume on the selloff has been larger than in recent weeks. The selloff has also been impulsive, again a strong indicator that we could be in for a change in market character. We remain bearish until the market can convincingly pierce through the major trendline.
Fundamentals
6. Valuation - Analyst estimates for 2010 are overly optimistic

But Wall Street's prescient analysts are forecasting the S&P will grow earnings by 34% in 2010, Consumer Discretionary will grow 58%, Energy 89%, Financials 137%, Tech 30% and Materials by 94%!
We've seen this same story since March 2008. Analysts are overly optimistic. On trailing earnings, using the generous operating earnings measure, the S&P is still at a very pricey 26 times earnings.
7. The Debt Piper Will Need to Be Paid - Julian Robertson, Tiger Capital
What most Wall Street investors are conveniently forgetting is that the U.S. government's bandaid approach to handling crises has created debts that will stay with us at best for a long long time and at worst send us the way that Japan is headed. David Einhorn of Greenlight Capital illustrates it far better than I could:
I won't bore you with the details but there is hardly any evidence of an economic recovery. Most of the earnings beats have been due to cost cutting and playing the Wall Street game of earnings beating "forecasts".
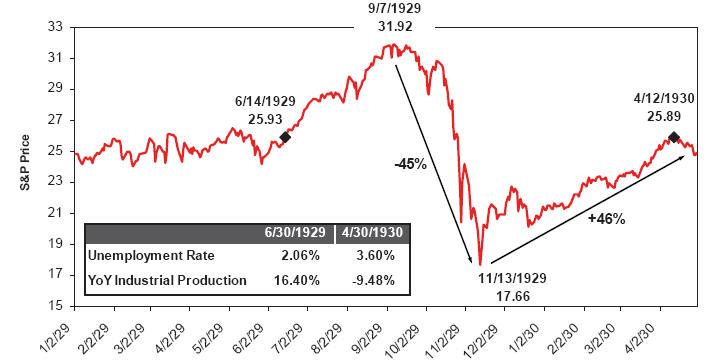
9. This rally is more likely a dead cat bounce similar to 1929-30
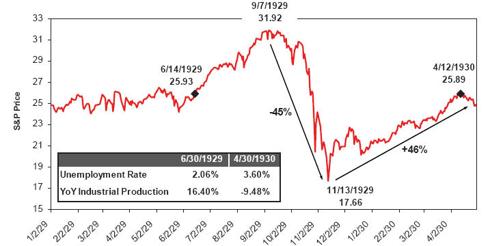
Source: GMO
The idea of significant rallies off severely oversold bear markets is not new. After the sharp decline in the fall of 1929, the S&P 500 rallied 46% from its low in November to the rally high of April 12, 1930. Economic commentary from those days suggested that participants were convinced a new bull market was underway. What followed to the horror of overly optimistic participants was a gut wrenching 80% decline.
10. The Option ARM crisis is real (2010), Commercial Real Estate is real (Capmark), the States Crises is real & the Consumer Is Spent
Stock markets usually lead the economy by 6 to 9 months. It's usually around this time that the economy starts delivering solid economic data. But when you see news items like Citibank raising credit card rates to 29.9% for all clients, you know that all is not well, not with the banks and not with the consumer.
We have yet to see significant improvements to justify the 56% market rebound that we have seen off the lows, so in our view the risks are now clearly to the downside. Market participants are starting to recognize this and stocks that are beating estimates are selling off.
One obvious caveat to our forecast is the Fed. The Fed, the Treasury and US government are committed to pulling out all stops to pull the US out of the Great Recession. But unless new programs are used to address the underlying problems that ail the economy, they are likely to be short term fixes. Further, the action in the dollar and other market action is sending signals that the U.S. will need to be very careful in announcing new programs.
Technicals - Time Price & Pattern Coinciding Suggest A Major Trend Change Is Imminent
The prevailing consensus is that Elliott Wave Theory is for crackpots and cannot be used profitably. Most analysts would agree with that opinion.
However, Elliot Wave (EW) was one of the few technical analyses to predict that the market would have a tremendous rally from the lows. Not only that we were able to exit the market at 682 based on a clearly identifiable pattern completion. While the consensus on EW is that it's a tough strategy to make money with, I'd point out that EW was used by legendary investors like Paul Tudor Jones to forecast and profit from the 1987 crash. More recently, Robert Prechter gained fame with an 800 point forecast shorting the S&P at the top and exiting at 720.
Most particularly, EW is at its most reliable when three factors - time, price and pattern - coincide. At these times, trend change is inevitable. Time will tell obviously as these are interesting times we live in.
1. Time - From October 2007, the S&P has completed a 38% time retrace and will complete a 50% time retrace on November 17th
2. Price - From Octoer 2007, the S&P has completed a 38% price retrace from the March lows and is nearing a 50% price retrace at 1117
3. Pattern - Since the March Lows, the S&P has completed an ABC corrective pattern
In our opinion, EW is forecasting that we are near completion of a multi month trend and an imminent change in direction is coming.

4. October 2007 Trendline Rejection & 5. March 2009 Trendline Break
As you can hopefully see from the chart above, the March 2009 trendline was convincingly broken today. In addition, the S&P 500 was repelled convincingly from a major trend line (Oct 07 to Apr 08) and the volume on the selloff has been larger than in recent weeks. The selloff has also been impulsive, again a strong indicator that we could be in for a change in market character. We remain bearish until the market can convincingly pierce through the major trendline.
Fundamentals
6. Valuation - Analyst estimates for 2010 are overly optimistic

Q3 Earnings for the S&P are currently estimated by Standard & Poors to be around $14.78. This translates to a negative year over year growth of -7.41% versus Q3 of 2008. Now do I need to remind you of where we were in Q3 2008? Does the collapse of Lehman serve as an appropriate benchmark? And even after all the handouts, bailouts, tarp buybacks, and a 50% rally, the S&P 500 hasn't been able to show year over year growth versus a very "easy comparable".
But Wall Street's prescient analysts are forecasting the S&P will grow earnings by 34% in 2010, Consumer Discretionary will grow 58%, Energy 89%, Financials 137%, Tech 30% and Materials by 94%!
We've seen this same story since March 2008. Analysts are overly optimistic. On trailing earnings, using the generous operating earnings measure, the S&P is still at a very pricey 26 times earnings.
7. The Debt Piper Will Need to Be Paid - Julian Robertson, Tiger Capital
What most Wall Street investors are conveniently forgetting is that the U.S. government's bandaid approach to handling crises has created debts that will stay with us at best for a long long time and at worst send us the way that Japan is headed. David Einhorn of Greenlight Capital illustrates it far better than I could:
Japan appears vulnerable, because it is even more indebted and its poor demographics are a decade ahead of ours. Japan may already be past the point of no return. When a country cannot reduce its ratio of debt to GDP over any time horizon, it means it can only refinance, but can never repay its debts. Japan has about 190% debt-to-GDP financed at an average cost of less than 2%. Even with the benefit of cheap financing the Japanese deficit is expected to be 10% of GDP this year. At some point, as American homeowners with teaser interest rates have learned, when the market refuses to refinance at cheap rates, problems quickly emerge. Imagine the fiscal impact of the market resetting Japanese borrowing costs to 5%.8. The Economic Landscape Has Not Confirmed the Market's Rally
Over the last few years, Japanese savers have been willing to finance their government deficit. However, with Japan’s population aging, it’s likely that the domestic savers will begin using those savings to fund their retirements. The newly elected DPJ party that favors domestic consumption might speed up this development. Should the market re-price Japanese credit risk, it is hard to see how Japan could avoid a government default or hyperinflationary currency death spiral...
For years, the discussion has been that U.S. deficit spending will pass the costs onto “our grandchildren.” I believe that this is no longer the case and that the consequences will be seen during the lifetime of the leaders who have pursued short-term popularity over our solvency. The recent economic crisis and our response has brought forward the eventual reconciliation into a window that is near enough that it makes sense for investors to buy some insurance to protect themselves from a possible systemic event. To slightly modify Alexis de Tocqueville: Events can move from the impossible to the inevitable without ever stopping at the probable. As investors, we can’t change the course of events, but we can attempt to protect capital in the face of foreseeable risks.
I won't bore you with the details but there is hardly any evidence of an economic recovery. Most of the earnings beats have been due to cost cutting and playing the Wall Street game of earnings beating "forecasts".
- Declining & downright scary Consumer Confidence numbers the past two months
- Cost cutting to generate earnings today will have impacts in future quarters
- While unemployment is a lagging indicator, jobless claims are coincident and the continued stubborn plus 500k levels of jobless claims each month the past few months are going to have structural impacts in the coming months
9. This rally is more likely a dead cat bounce similar to 1929-30
Source: GMO
The idea of significant rallies off severely oversold bear markets is not new. After the sharp decline in the fall of 1929, the S&P 500 rallied 46% from its low in November to the rally high of April 12, 1930. Economic commentary from those days suggested that participants were convinced a new bull market was underway. What followed to the horror of overly optimistic participants was a gut wrenching 80% decline.
10. The Option ARM crisis is real (2010), Commercial Real Estate is real (Capmark), the States Crises is real & the Consumer Is Spent
Stock markets usually lead the economy by 6 to 9 months. It's usually around this time that the economy starts delivering solid economic data. But when you see news items like Citibank raising credit card rates to 29.9% for all clients, you know that all is not well, not with the banks and not with the consumer.
We have yet to see significant improvements to justify the 56% market rebound that we have seen off the lows, so in our view the risks are now clearly to the downside. Market participants are starting to recognize this and stocks that are beating estimates are selling off.
One obvious caveat to our forecast is the Fed. The Fed, the Treasury and US government are committed to pulling out all stops to pull the US out of the Great Recession. But unless new programs are used to address the underlying problems that ail the economy, they are likely to be short term fixes. Further, the action in the dollar and other market action is sending signals that the U.S. will need to be very careful in announcing new programs.
Why Japan Is In Worse Shape Than the U.S.
Another on target analysis and the reason why it makes sense for all investors to protect themselves from an inflationary spiral in the U.S. Secondly, many investors are looking to diversify out of dollars, are Yen really that better a choice? What about the pound or the euro? lots of issues there as well.
Japan appears vulnerable, because it is even more indebted and its poor demographics are a decade ahead of ours. Japan may already be past the point of no return. When a country cannot reduce its ratio of debt to GDP over any time horizon, it means it can only refinance, but can never repay its debts. Japan has about 190% debt-to-GDP financed at an average cost of less than 2%. Even with the benefit of cheap financing the Japanese deficit is expected to be 10% of GDP this year. At some point, as American homeowners with teaser interest rates have learned, when the market refuses to refinance at cheap rates, problems quickly emerge. Imagine the fiscal impact of the market resetting Japanese borrowing costs to 5%.
Over the last few years, Japanese savers have been willing to finance their government deficit. However, with Japan’s population aging, it’s likely that the domestic savers will begin using those savings to fund their retirements. The newly elected DPJ party that favors domestic consumption might speed up this development. Should the market re-price Japanese credit risk, it is hard to see how Japan could avoid a government default or hyperinflationary currency death spiral.
For years, the discussion has been that our deficit spending will pass the costs onto “our grandchildren.” I believe that this is no longer the case and that the consequences will be seen during the lifetime of the leaders who have pursued short-term popularity over our solvency. The recent economic crisis and our response has brought forward the eventual reconciliation into a window that is near enough that it makes sense for investors to buy some insurance to protect themselves from a possible systemic event. To slightly modify Alexis de
Tocqueville: Events can move from the impossible to the inevitable without ever stopping at
the probable. As investors, we can’t change the course of events, but we can attempt to protect
capital in the face of foreseeable risks.
Love 'Em At the Highs, Hate 'Em At the Lows

These were my thoughts from last week. The tells were in the Transports, the Semiconductor index, and eventually Financials started leading the market lower. Tech was the last to break down and the market tanked only after the 4 horsement were shot down (google, apple, goldman, ibm).
Short the SMH $26.07, Short the Russell IWM $62.35
Taking Profits at S&P 1053
That's a solid 40 point move and time to take profits. Elliott patterns indicate a 3 wave selloff is complete.
Moreover, this is the first time in months that the market has not rallied after piercing below the 20 day moving average. Looks like this time the trend is different and my plan is to short all rallies going forward.
Fundamentally the new home sales number was surprisingly weak, but the more important news was yesterday's consumer confidence series, one of the less manipulated economic series out there.
Looking to build positions in Netflix, Vonage, and Gafisa GFA and adding very small
Letting profits ride on Bank of Ireland IRE
S&P 500 1053
Tuesday, October 27, 2009
Strongly Bearish - Strong Recovery, Weak Markets Going Forward
Just as 2009 was a tale of a weak economy accompanied by a strong stock market, we forecast that next year will reverse the situation with strong economic news accompanied by a weak stock market.
A lesson that I was well aware of has been reinforced in the minds of market participants yet again and this time indelibly. After a very large decline, the market was poised to recover sharply with the assistance of rocket fuel provided by the Fed. A review of the 1929 crash showed a last hurrah when after the sharp decline in the fall of 1929, the S&P 500 rallied 46% from its low in November to the rally high of April 12, 1930. It then, of course, fell by over 80%.

History’s greatest stimulus program, desperate bailouts, and clear promises of years of low rates and an ocean of liquidity ensured that this cycle's rally was going to be the best ever. Looking at previous rallies following deep corrections, this market followed the same playbook. Lesson: Don't Fight the Fed, yet again. Some things never change.
However, considering recent history as well as past cycles, these types of interventions - and this one was unprecedented - do seem to breed
severe problems down the road. So, we anticipate that the markets will continue to be a minefield for many years going forward, confounding investors and destroying wealth of those that are unwary. Good reasons to consider competent long / short wealth managers.
As we move forward, we expect to see economic green shoots of some variety and corresponding good to decent economic news. Inventories will recover, capacity utilization will bounce back and we are already seeing signs of rising real estate prices. It is our opinion though that this is a headfake, the mother of all headfakes.
Market valuation will be an issue at some point. P/E ratios are at historically high levels. Until we consume less, pay down debt, and realign our
lives to being less capital-rich, this market and economy will not be healthy and this could be a period similar to the mid 70s or late 30s. The other scenario that comes to mind is Japan as we have followed a resolution model that closely mimics theirs with a leverage factor many times greater.
Finally, China looks to be an economic ponzi scheme perpetuated by the government. More later.
To put it briefly, I am decidedly bearish going forward and am looking for a major correction in the coming months, one that will take us past 800 on the downside at the minimum.
S&P 500: 1069
DJIA: 9925
Nasdaq Comp: 2135
A lesson that I was well aware of has been reinforced in the minds of market participants yet again and this time indelibly. After a very large decline, the market was poised to recover sharply with the assistance of rocket fuel provided by the Fed. A review of the 1929 crash showed a last hurrah when after the sharp decline in the fall of 1929, the S&P 500 rallied 46% from its low in November to the rally high of April 12, 1930. It then, of course, fell by over 80%.
History’s greatest stimulus program, desperate bailouts, and clear promises of years of low rates and an ocean of liquidity ensured that this cycle's rally was going to be the best ever. Looking at previous rallies following deep corrections, this market followed the same playbook. Lesson: Don't Fight the Fed, yet again. Some things never change.
However, considering recent history as well as past cycles, these types of interventions - and this one was unprecedented - do seem to breed
severe problems down the road. So, we anticipate that the markets will continue to be a minefield for many years going forward, confounding investors and destroying wealth of those that are unwary. Good reasons to consider competent long / short wealth managers.
As we move forward, we expect to see economic green shoots of some variety and corresponding good to decent economic news. Inventories will recover, capacity utilization will bounce back and we are already seeing signs of rising real estate prices. It is our opinion though that this is a headfake, the mother of all headfakes.
Market valuation will be an issue at some point. P/E ratios are at historically high levels. Until we consume less, pay down debt, and realign our
lives to being less capital-rich, this market and economy will not be healthy and this could be a period similar to the mid 70s or late 30s. The other scenario that comes to mind is Japan as we have followed a resolution model that closely mimics theirs with a leverage factor many times greater.
Finally, China looks to be an economic ponzi scheme perpetuated by the government. More later.
To put it briefly, I am decidedly bearish going forward and am looking for a major correction in the coming months, one that will take us past 800 on the downside at the minimum.
S&P 500: 1069
DJIA: 9925
Nasdaq Comp: 2135
Time Cycles & Trend Lines Suggest a Trend Change
The S&P 500 has been repelled convincingly from a major trend line (Oct 07 to Apr 08) and the volume on the selloff has been larger than in recent weeks. Further the selloff has been impulsive.
Secondly the rally just recently surpassed the 38.1% time cycle from the Major top in October 2007 and is coming up on the 50% retracement. In addition, the market tried to approach the 50% price retrace, came close and was repelled strongly.
Finally the wave structure seems to suggest that we may have completed an ABC rally from the March 2009 lows.
All strong factors that could be signalling a trend change. But I learnt a long time ago that it is far better to let the market tell you when the trend has changed rather than forming my expectations.
My Portfolio is net short going forward and will be looking to short rallies.
A market move above 1120 will cause me to strongly revise my thesis.
Fundamentally the market also appears to have realized that the green shoots exist in the minds of bulls only. The market has also done an admirable job of convincing most participants that a recovery is underway, precisely the conditions necessary for a selloff.
About Absolute Capital
I am an investment manager and have been in the market since 1988, first with mutual funds, then stocks, now stocks, futures, commodities, currencies.
Hedge funds, asset managers, FAs and mutual funds spend 80% if not 99% of their time analyzing long investments, while we spend the majority of our time analyzing shorts...They are fighting to generate alpha with one hand tied behind their back, while my approach is trading in the direction of the trend and a goal of absolute returns.
It is a passion and over 20 years I’ve learnt many lessons.
I have a CFA, MBA, BSc from all the right schools. The Ivy's are useless and a waste of money in preparing you for success in investing. I worked on Wall Street since 1988, left in 2003, now work independently.
Why Absolute Capital? No one cares if you lost 40% last year but outperformed the S&P. Our investment objective is absolute returns regardless of the market environment.
Subscribe to:
Posts (Atom)